9
GDS Global Limited Annual Report 2015
OPERATIONS AND
FINANCIAL REVIEW
For the financial year ended 30 September 2015 (
“FY2015”
), the Group reported a net profit of S$3.35
million as revenue dropped 8.4% to S$21.88 million as compared to the financial year ended 30 September
2014 (
“FY2014”
).
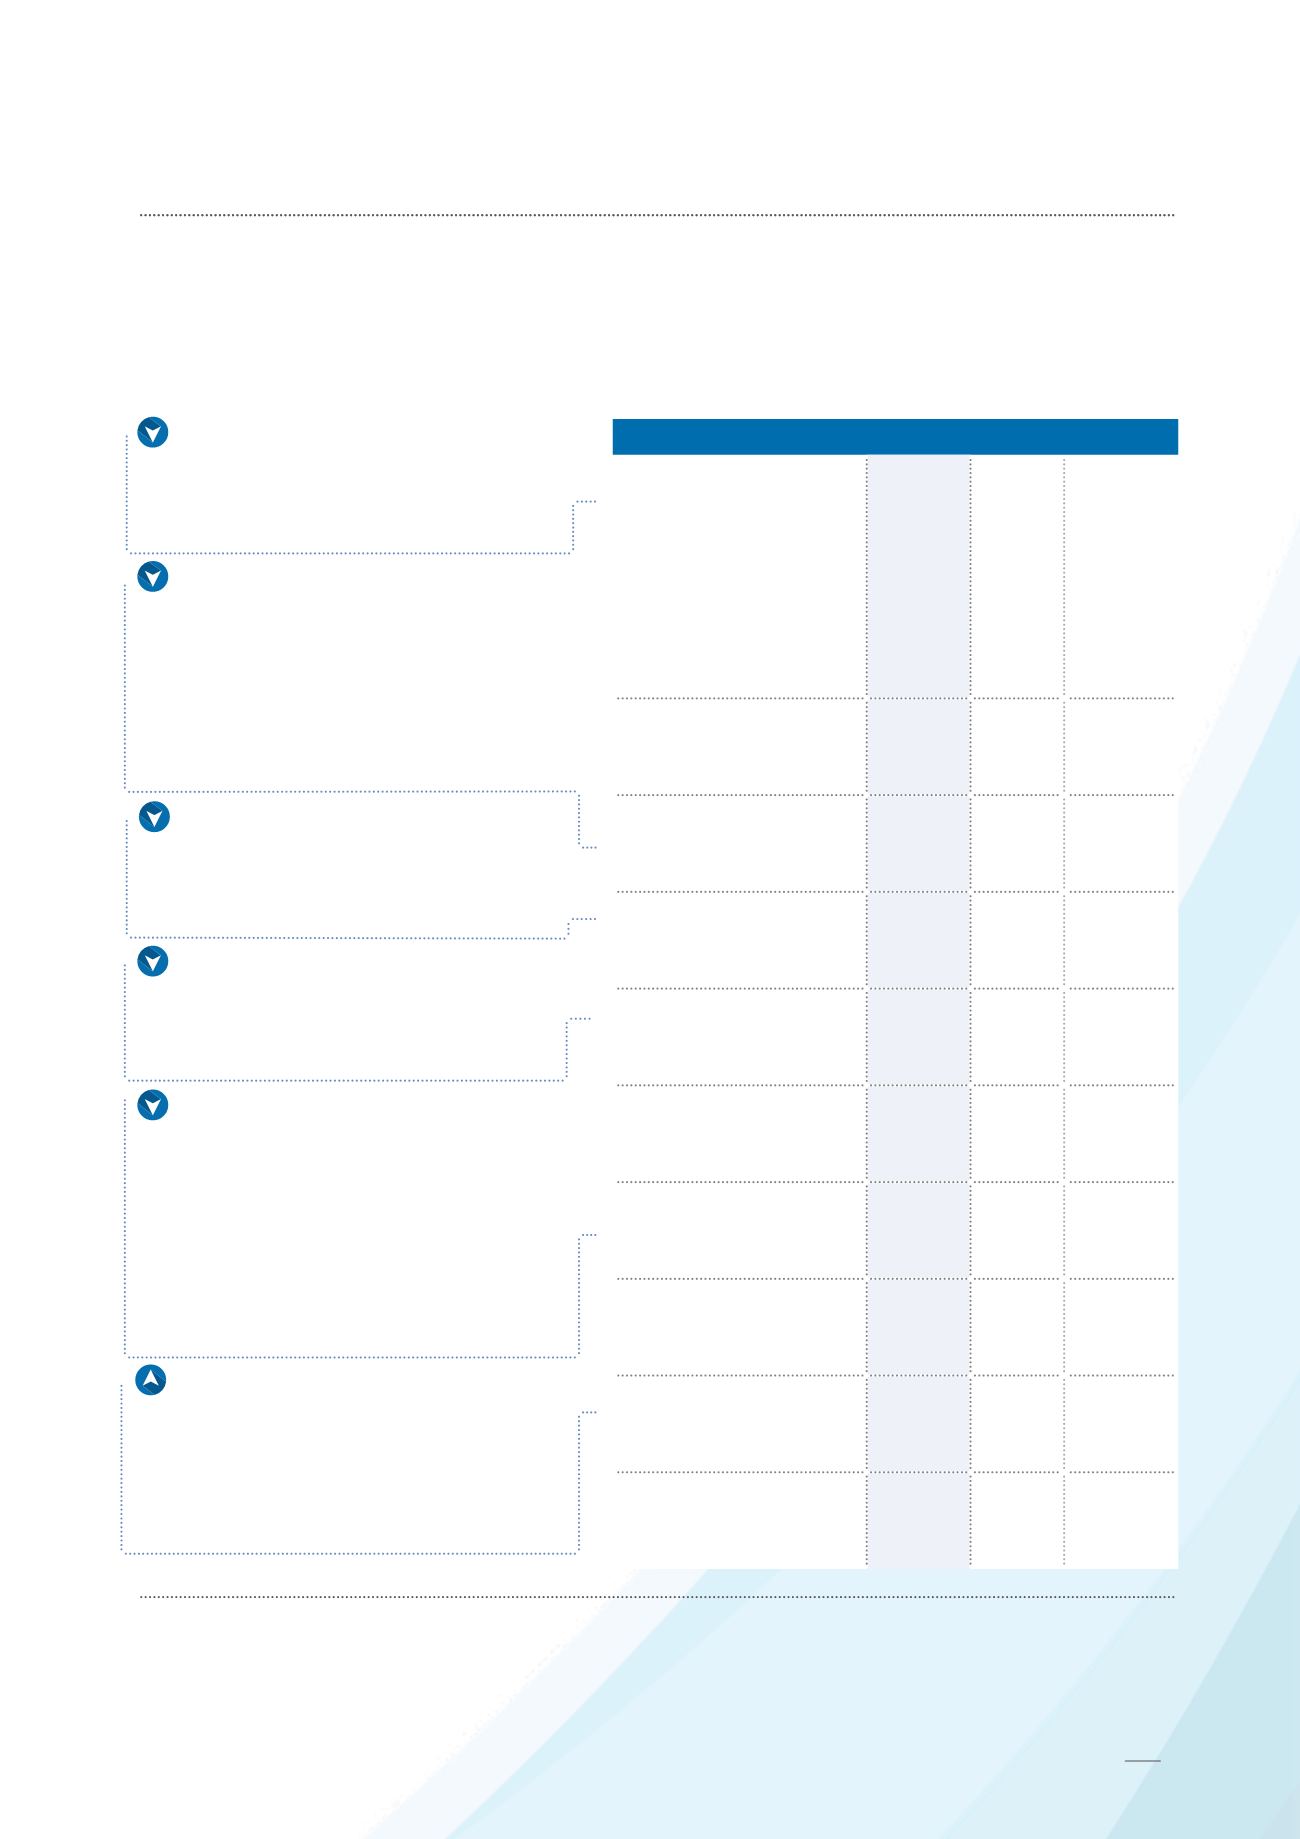
INCOME STATEMENT
S$’000
FY201
5
FY2014 Change(%)
Revenue
2
- Sale of door and
shutter systems
- Provision of service
and maintenance
works
21,879
20,291
1,588
23,872
22,156
1,716
(8.4)
(8.4)
(7.5)
Cost of sales
(12,332)
(12,779)
(3.5)
Gross profit
9,547
11,093
(13.9)
Other operating income
301
613
(51.0)
Marketing and
distribution expenses
(639)
(780)
(18.1)
Administrative expenses
(5,627)
(5,621)
0.1
Other operating
expenses
(289)
(343)
(15.8)
Investment revenue
16
16
-
Other gains and losses
355
41
762.8
Finance costs
(1)
(5)
(88.2)
2
The Group operates and manages its business primarily as a single operating segment in the manufacture and supply of door and
shutter systems and provision of service and maintenance works. As such, no operating segmental revenue and results have been prepared.
Revenue:
Due to the decrease in the
sale of door and shutter systems which was
mainly attributed to the absence of sales
arising from delayed projects which spilled
over from FY2013 to FY2014.
Gross profit:
Gross profit margin
decreased from 46.5% in FY2014 to 43.6%
in FY2015, which was mainly attributed to
some items of cost in the cost of sales,
which were fixed in nature. Accordingly,
the lower revenue in FY2015 did not
result in a proportional decrease in cost of
sales and gross profit margin was lower in
FY2015.
Other operating income:
Mainly
attributed to the decrease in rental income
arising from the cessation of the sub-letting
of the Group’s premises in July 2014 upon
the termination of the lease.
Marketing and distribution expenses:
Mainly attributed to the decrease in
transportation expenses which was in
line with the decrease in revenue during
FY2015.
Other operating expenses:
Mainly
due to the absence of impairment loss on
trade receivables arising from customers
placed under liquidation of S$0.16 million
which occurred in FY2014.
This was partially offset by the increase in
(i) research and development expenses
of S$0.06 million; and (ii) repair and
maintenance expenses of S$0.04 million in
FY2015.
Other gains and losses:
Mainly
attributed to the increase in (i) net foreign
exchange gains of S$0.28 million arising
from the translation of trade receivables
and bank balances denominated in US$;
and (ii) gain on disposal of property, plant
and equipment of S$0.04 million.


