10
GDS Global Limited Annual Report 2015
OPERATIONS AND
FINANCIAL REVIEW
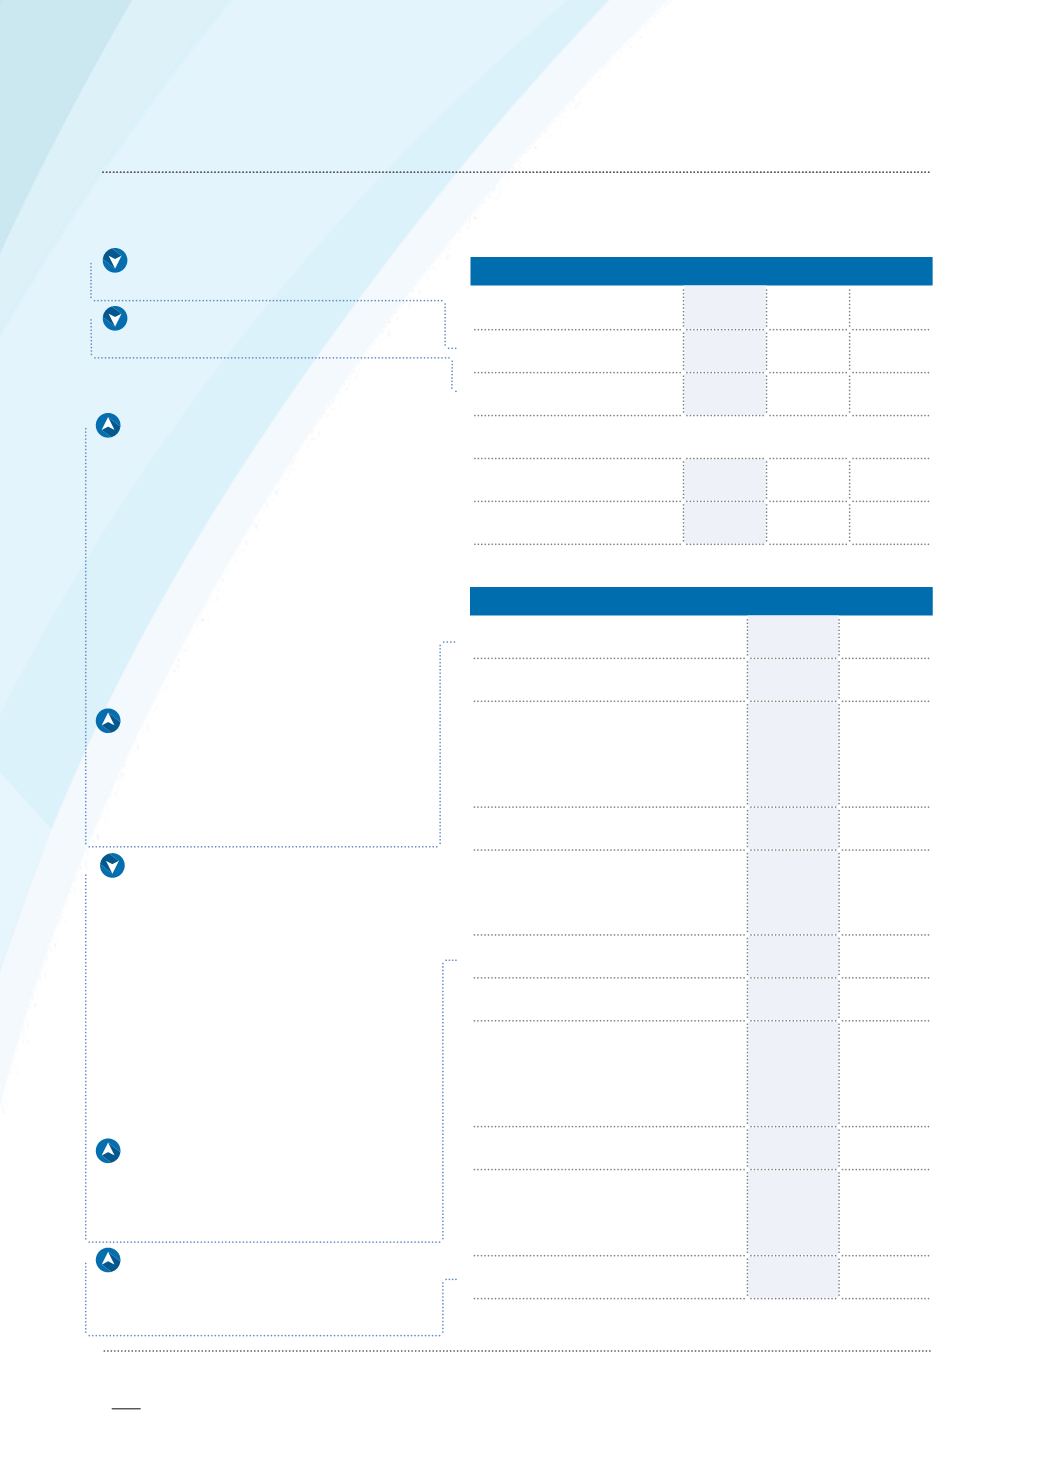
INCOME STATEMENT (CONT’D)
FINANCIAL POSITION
S$’000
FY2015
FY2014 Change(%)
Profit before tax
3,663
5,014 (26.9)
Income tax expense
(318)
(608)
(47.7)
Profit for the year
3,345
4,406 (24.1)
Profit (Loss) attributable to:
Owners of the Company
3,288
4,512 (27.1)
Non-controlling interests
57
(106)
n.m.
3
S$’000
FY2015
FY2014
Total Assets
23,973
22,838
Total current assets
20,027
18,906
Cash and cash equivalents
Pledged bank deposits
Trade and other receivables
Inventories
8,095
1,000
8,706
2,226
8,098
-
8,517
2,291
Total non-current assets
3,946
3,932
Property, plant and equipment
Intangible asset
Pledged bank deposits
2,550
1,266
130
1,572
1,360
1,000
Total Liabilities
4,410
5,384
Total current liabilities
3,452
5,034
Bank borrowings
Trade and other payables
Current portion of finance leases
Income tax payable
131
3,116
-
205
-
4,515
3
516
Total non-current liabilities
958
350
Bank borrowings
Deferred tax liabilities
Other payables
517
424
17
-
336
14
Total Equity
19,563
17,454
Income tax expense:
In line with the
lower profit before tax in FY2015.
Profit for the year:
Mainly a result of
the above.
Current assets:
Mainlydue to the increase
in (i) pledged bank deposits maturing within
the next twelve months of S$1.00 million as
such deposits were reclassified from non-
current assets as at 30 September 2014 to
current assets as at 30 September 2015; and
(ii) trade and other receivables of S$0.19
million mainly attributed to the increase in (a)
trade receivables of S$0.81 million as a result
of slower repayments from customers in
FY2015; (b) other receivables of S$0.51 million
arising from the advance of loan to a third
party; and (c) prepayments of S$0.15 million,
partially offset by the decrease in deposits
placed for the purchase of inventories from
the Group’s principals of S$1.26 million.
Non-current assets:
Due to the purchase
of property, plant and equipment, partially
offset by depreciation and amortisation
during FY2015. The increase was also
partially offset by the reclassification of
pledged bank deposits from non-current
assets to current assets as explained above.
Current liabilities:
Mainly due to the
decrease in (i) trade and other payables
of S$1.40 million mainly attributed to
the decrease in deposits received from
customers of S$1.99 million, partially offset
by increase in trade payables of S$0.69
million as the Group made payments in
respect of a smaller proportion of trade
payables; and (ii) income tax payable of
S$0.31 million.
This was partially offset by the increase in bank
borrowings (current) of S$0.13 million due to
new loans of S$0.65 million drawn down by a
subsidiary forworkingcapitalpurposes inFY2015.
Non-current liabilities:
Due to the increase
in (i) bank borrowings (non-current) of S$0.52
million due to new loans drawn down by a
subsidiary as explained above; and (ii) deferred
tax liabilities of S$0.09 million.
Total equity:
Mainly due to the profits
earned and changes in non-controlling
interests during FY2015, partially offset by
the dividends paid.
3
n.m. denotes not meaningful.


